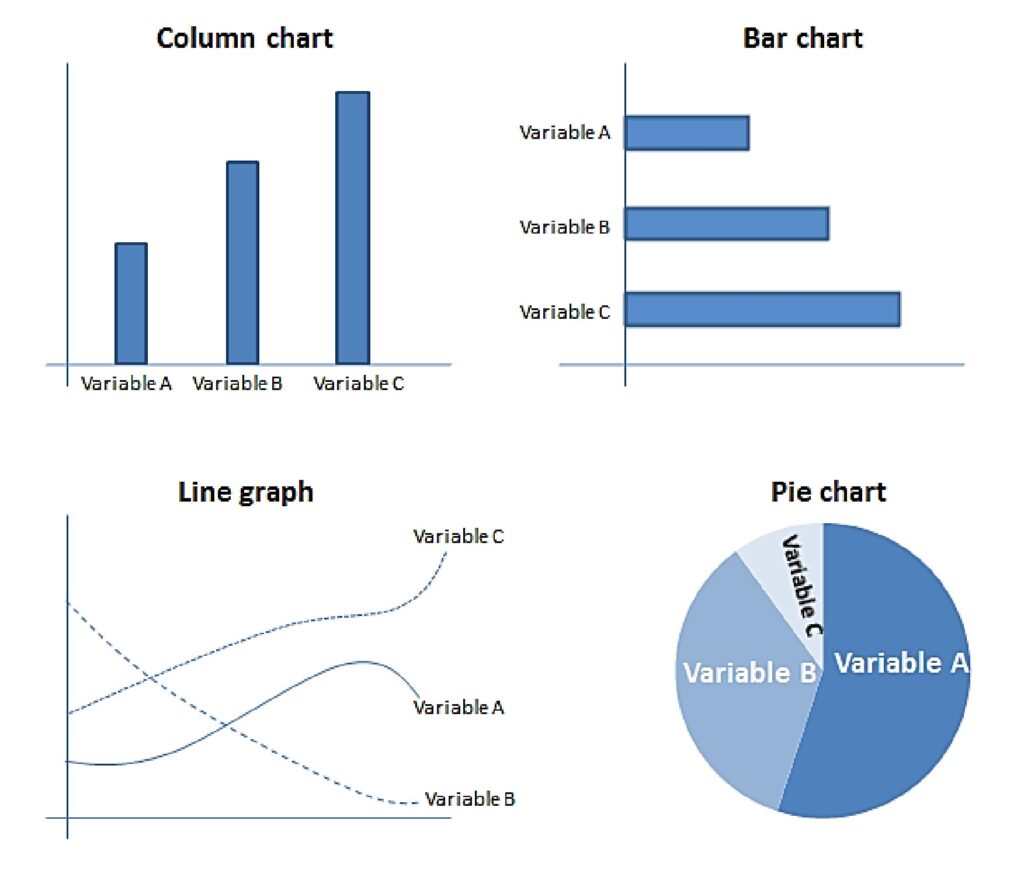
For economic-financial decision-making, the representation of the indicators through graphs is also helpful since, for example, they allow us to observe trends clearly over time or to identify a data that is of special interest for the analysis that is being carried out. Before addressing the most common types of graphs, it is suitable to clarify a series of concepts related to them, such as the following:
- Types of data: Qualitative and quantitative. Qualitative data refer to a specific property or quality of the variable considered and, therefore, cannot be represented numerically. An example of a variable of this type could be, for example, the “rating” that a rating agency grants to a debt issuance, which is not expressed by a numerical value, but is a set of letters and symbols that represent the credit risk of the issuance. On the other hand, quantitative data are characterized by being expressed by numbers. An example of a variable expressed with quantitative data could be the GDP of a country.
- Stock variables and flow variables. A stock variable is one whose data refer to a specific moment in time, while the data of a flow variable refer to a period. For example, the wealth of a person would be a stock variable, since this variable can be known at a given moment in time, while the savings that a person generates would be a flow variable, since savings can be “added” to determine it over a period of time, usually one year.
The most common types of graphs in economic and financial analysis are the following: